

Maui Real Estate Market Update “March 2023” First Quarter Report Q1
Aloha LivingOnMaui.com readers!
First of all, you know that you can read get my free Maui Real Estate Market report here. Click here. It is courtesy of the Realtors Association of Maui. I post it on my website by the end of first week or 2nd week of the Month.
The Newest Listings in Maui, Click here.
Hawaii Statewide Trends – Jan 2023.pub. Courtesy of Fidelity National Title. Email me for specific island reports such as Kauai, Oahu or Big Island.
In addition to the Maui Real Estate Market Report, I want to give you my interpretation and anecdotal take. You may assume that since Maui is an island, interpreting the data may be straightforward and give you a good snapshot of the condition of our market. Although Maui is an island, and actually Maui County includes several islands (such as Lanai and Molokai in addition to Maui), there are submarkets. These submarkets behave differently from one another which could affect your decision-making. One could say, we have a bifurcated market (luxury and median-priced residential home market) or even a trifurcated market (luxury, median-priced residential home and vacation rental). Because I have a lot of investor readers on my blog, I am going to divide the market into 3’s so you get a more detailed, nuanced view.
Before we move forth. Lets look back to get some perspective. Last year in early 2022 we had an influx of buyers, smelling the rise of interest rates thus racing to lock in on a purchase with the historically low interest rates.
January 12, 2022: Average interest rates for 30 year fixed rate mortgage was 3.6%. Rates steadily climbed throughout the year and thus the average interest for for 2022 was 5.34% according to Freddie Mac.
April 22, 2023: Average interest rates for 30 year fixed rate mortgage is 6.4%
So for a $1,000,000 Home loan here is the difference in monthly payment (only includes principal and interest for simplicity):
3.6%: $4546.45
6.4%: $6255.06
That is a $1708.61 Difference!
The average interest rate for 2021 was 2.96% for 30 year fixed rate. Many owners who carried a mortgage found it also an opportune time to refinance to this incredibly low rate. To understand the historically low rate nature of 2.96% rate, see the chart below from Freddie Mac.

So one would think due to higher interest rates the Maui market would drop significantly, but rather the prices have held steady for a significant part of our market. Why? Well, one of the main reasons is simply inventory. Interestingly enough because you have owners that hold such historically low interest rate loans, they are not readily open to selling and buying unless there is an important reason that moves them to sell/buy as job change, or some kind life change, etc. So with our inventory still so low, and buyers (still cash buyers out there) willing to buy a good property priced at or around market value (not over market) then you find properties selling quick and still receiving multiple offer situations.
Let’s put this in perspective.
Inventory of Maui single family homes for sale at given date:
- March 2011: 958 Units
- March 2013: 645 Units
- March 2015: 746 units
- March 2017: 700 Units
- March 2018: 515 units
- March 2019: 543 units
- March 2020: (pandemic!) 481 units
- March 2021: 253 units
- March 2022: 229 units
- March 2023: 264
Of course, the over-exuberant seller with a home in less than prime condition/location may find themselves chasing down the market. The volume of sales have gone down and one wonders if there were more market priced inventory would we have more total volume dollar/unit in sales? We may never know but it is a valid question.
So the big question is: Is the Maui Real Estate Market Normalizing? It remains yet to be known as a fact but the steady hold on prices is suggesting a more graceful approach on the market trend. Perhaps what the FED has been calling a “softer landing”?
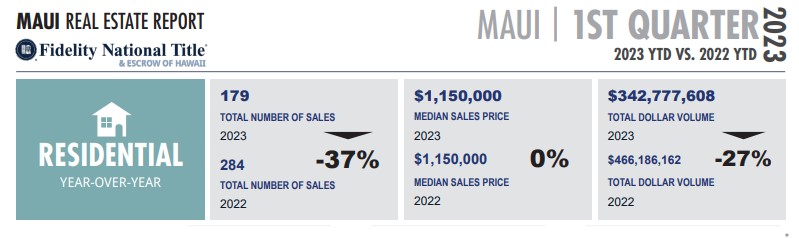
The overall median priced market is the one most affected by interest rates. The median priced single family home in March YTD 2023 was $1,150,000 (0% change compared to the same time in 2022). March 2023 figures were actually $1,200,000 which was 1.9% higher than the previous month.
Again you can get the full Maui Real Estate Market Report Here.
The Single Family Residential Market (year to date 2023)
The percentage of list price received was 96.4% which is down about -3% from the same YTD last year.
Inventory has gone up from March of last year about 15.3% to 264 units. But new listings are down -42.2% to 219 units.
Days on market for YTD gone up about 9.8% to 124 days.

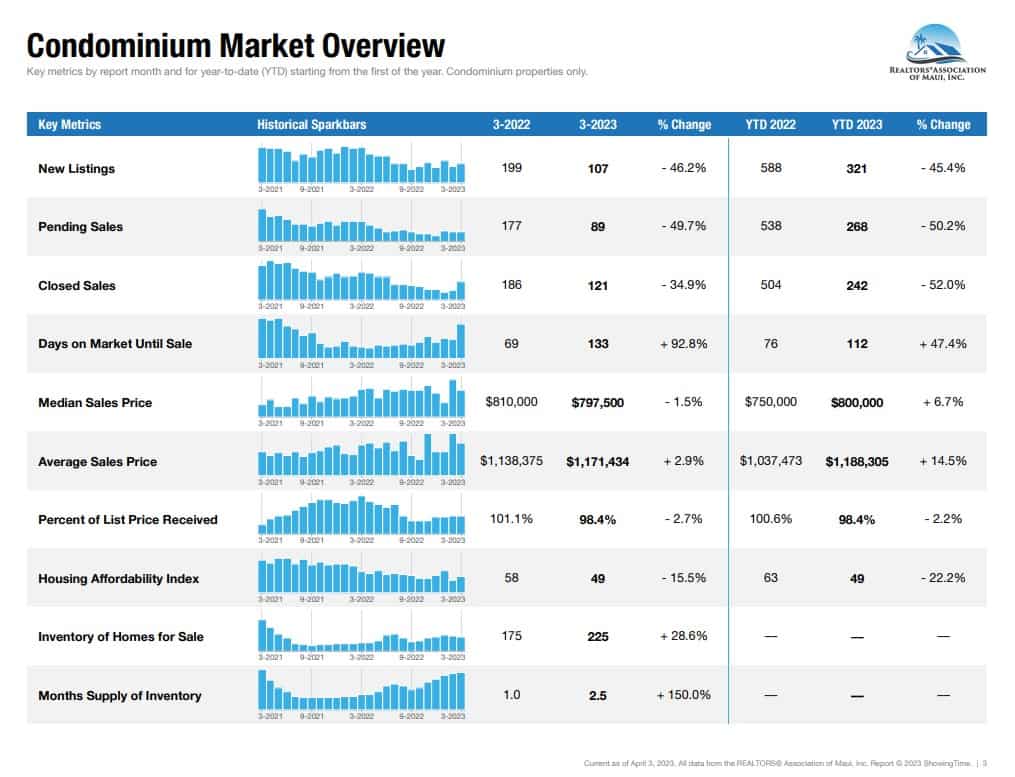
The Maui Condominium Market
Current Short Term Rentable Condos Active for Sale
Current Long Term Rentable Condos Active for Sale
All Condominums on Island of Maui for Sale
There are in my opinion 2 markets (short-term rentals and long-term rentals) here but our general stats lump them into one. I will give you the bifurcated stats below the general overall market. Generally speaking, short-term rentals are condos that allow vacation rentals and long-term rental condos only allow rentals of 6 months or longer. Keep in mind that an owner can live as a full-time resident in either one of these kinds of condos, but there tends to be more owner-occupants in long-term rental-only condos.
All condominiums (see stats below for the first quarter). The median price has risen 7% to $800,000 while the volume has gone down considerably -45% compared to first quarter 2022 YTD figures.
First Quarter 2023 YTD (Short-term rentable condominiums)
- 111 Units sold
- 31 units pending under contract (January 1, 2023- March 31, 2023)
- Median price sold $899,100
- Average Days on Market sold: 97
- 55 condos were cash sales, 48 had financing and 8 were 1031 exchanges
- Averaged 98% percentage of list price received
First Quarter 2022 YTD (Short-term rentable condominiums)
- 285 Units sold
- Median Price sold was $830,000
- Average Days on Market Sold: 82
- 128 condos were cash sales, 137 had financing, 20 were 1031 exchanges
- Averaged 100% percentage of list price received
Quick Anectodotal Take: Condos in a great location with ocean views and priced may still get multiple offers. Consider a different approach if you want to avoid multiple offer situations. Work with an experienced realtor!
First Quarter 2023 YTD (Long-term only rentable condominiums)
- 93 units sold
- Median price sold was $655,000
- Average Days on Market Sold: 279
- 37 condos were cash sales, 50 had financing, 5 were 1031 exchange and 1 was “other”
- Averaged 99% percentage of list price received
First Quarter 2022 YTD (Long-term only rentable condominiums)
- 140 units sold
- Median price sold was $567,500
- Average Days on Market Sold: 68
- 51 condos were cash sales, 88 had financing, 1 was 1031 exchange
- Averaged 102% percentage of list price received
Luxury Market (Homes and Condos 3M and above)
Current Homes Active for Sale at 3M and Over.
Current Condominiums Active for Sale at 3M and Over.
First Quarter 2023 YTD: Single Family Homes
- Pending: 14 single famiy homes under contract listed at 3M and over.
- Sold: 21 single family homes sold at 3m and above. Click here for more info and photos.
- Avg. Days on Market Sold: 137 days
- Median Price Sold: $5,700,000
- Averaged 96 % percentage of list price received
- 15 were cash sales, 4 had financing and 2 had purchase money mortgage
- Highest Price Sold: $32,673,491 Cash sale. 4572 Makena Rd. Makena, HI
First Quarter 2022 YTD: Single Family Homes
- Sold: 20 single family homes sold at 3m and above. Click here for more info and photos
- Avg. Days on MarketSold: 116 days
- Median Price Sold: $4,475,000
- Averaged 98 % percentage of list price received
- 13 were cash sales, 7 had financing
- Highest Price Sold: $18,500,000 Cash sale. 37 Ualei Place
Quick Anecdotal Take: Sellers in this price range typically have staying power. Meaning they can afford to stay on the market until a buyer comes along to meet their price. So don’t let “days on market” fool you that a great deal can be had -possible but not certain. That being said 2022 YTD figures showed 98% average percentage of list price received against 96% this year so perhaps a bit more wiggle room for a buyer?
First Quarter 2023 YTD: Condominiums
- Pending: 18 under contract listed at 3M and over (15 of the units are Lai’Loa which were presales)
- Sold: 9 units sold at 3m and above. Click here for details and photos.
- Avg. Days on Market Sold: 504 days
- Median Price Sold: $10,800,000
- Averaged 99% percentage of list price received
- 7 were cash sales, 2 had financing
- Highest Price Sold: $13,000,000
Quick Anecdotal Take: Of the 9 units sold, 5 of those were Makena Golf and Beach Club units. They have been pending under contract for over 500 days. The reason it sold in this quarter is that the units are brand new and could not close until the unit building was complete. All 5 of the units went under contract in year 2021. Therefore the “days on market” is misleading and also this affected the average list price sold. If you took out the Makena Golf and Beach Club units that there would be 4 sold, median $4,224,000 sold price, 338 average days on market, and averaged 98% of list price received. Again t his market is less sensitive to interest rate hikes as you can see that majority of these purchases are cash.
*Montage Residences unit 2206 had 974 days on market. It was listed at $3,800,000 when it sold on 2/21/23 for $3,650,000 which is 96% of list price.
**When we are dealing with such small aggregate numbers, a low or high number can affect the averages quite and bit and may lead you to misleading conclusions so it is important to work with an experienced realtor and do more detailed research with quality data that is more relevant to your decision making.
First Quarter 2022 YTD: Condominiums
- Sold: 22 units sold at 3m and above. Click here for more info and photos.
- Avg. Days on Market Sold: 77 days
- Median Price Sold: $4,000,000
- Averaged 98% percentage of list price received
- 19 were cash sales, 4 had financing, 2 were 1031 exchanges
- Highest Price Sold: $8,000,000
Quick Anecdotal Take: Beginning of 2022, buyers were rushing to take advantage of the historically low interest rates. But in this higher price range interest rates are less sensitive to buyers. But the stock market and crypto market showed volatility which created some uncertainty. But the desire to have a Maui property to share and create memories proves to be a strong force.


A hui hou…

Watch Video Of Big Beach, Makena at Sunset
Disclaimer: Data is from Realtors Association of Maui. It is deemed reliable but not guaranteed. The quality of the input affects data. Also, not all listings input if either a unit is short term or long term as it is not a requirement so those figures can have particular variability. Please note due to low aggregate quantity, low or high numbers can skew averages. Please consult with experienced and trusted data for more qualified and relevant data to your particular property of interest. This market report is reflective for trends rather than a specific data point.
