
Maui Real Estate Market Update: What the First Half of 2026 Really Tells Us
If you’ve been watching Maui real estate headlines this year, you’ve probably seen confusing signals — “sales are up,” “prices are down.” Both are true, and understanding why is the difference between making a smart move and misreading the market.
Here’s what actually happened across Maui in the first half of 2026, based on data from the Realtors Association of Maui, and what it means if you’re buying, selling, or just keeping an eye on your investment.
The Headline: More Deals, Smaller Checks
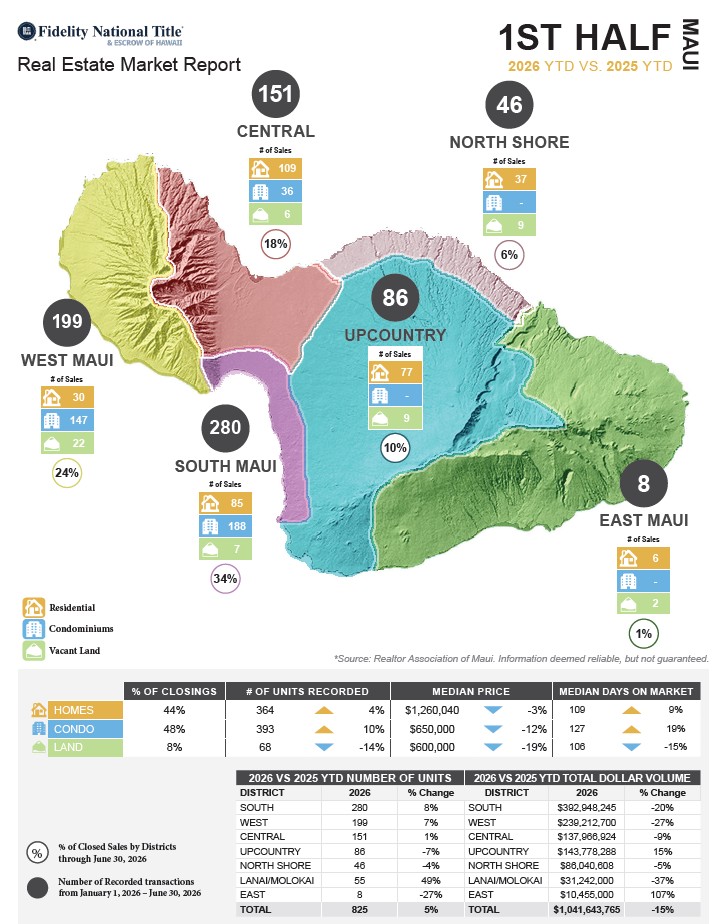
Across the island, 825 properties closed in the first half of 2026 — up 5% from the same period last year. But total dollar volume fell 15%, to just over $1.04 billion.
That combination — more transactions, less money changing hands overall — tells you the market is active, but buyers are finding value at lower price points rather than stretching for the top of the market. It’s not a slowdown but rather buyers looking for deals.
Homes: Still Appreciating, Slightly Slower to Move
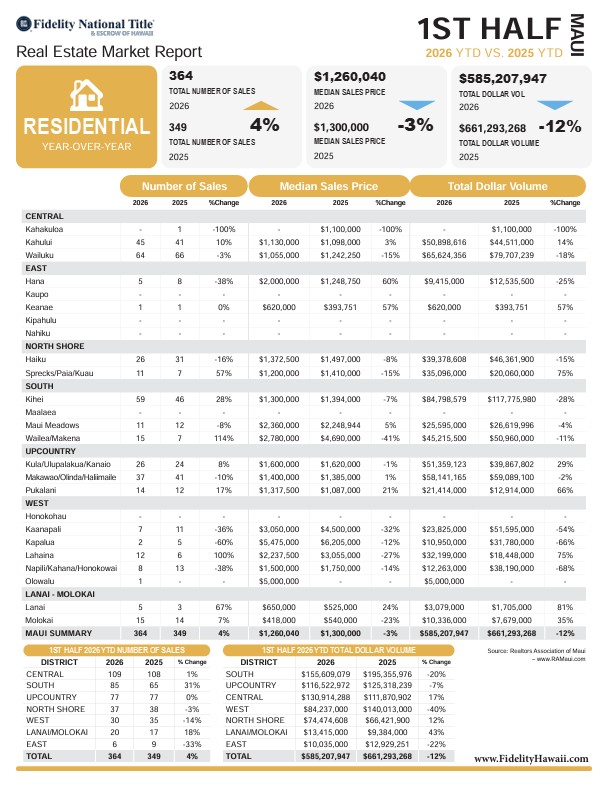
- 364 homes sold, up 4% year-over-year
- Median price: $1,260,040, down 3%
- Median days on market: 109, up from 100
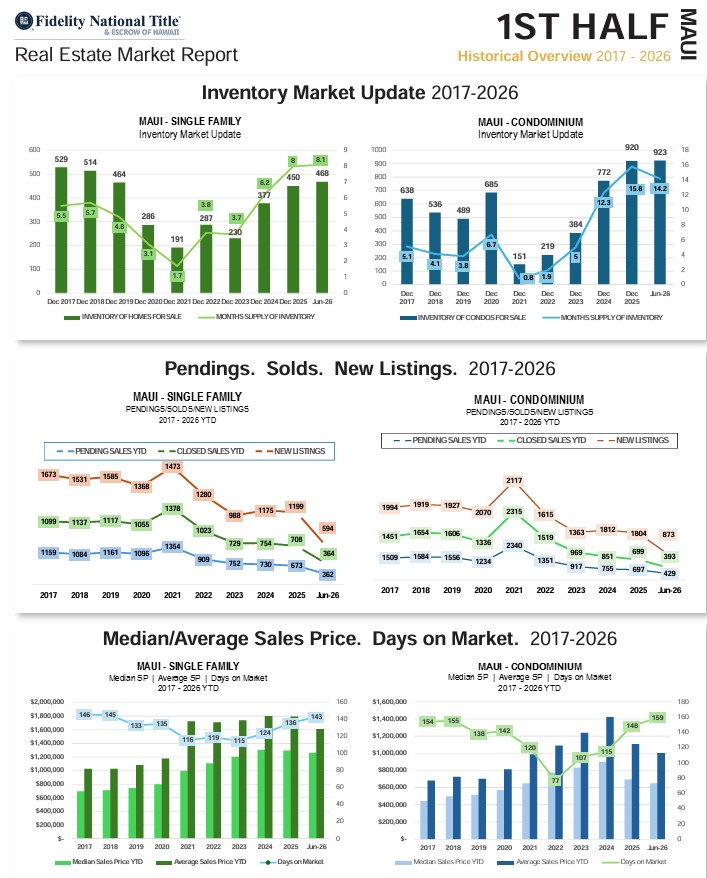
- 8.1 months of supply, compared to 14.2 months for condos
- Only 26% of homes sold at or above asking, vs. 30% from last year
Homes are still the more resilient asset class on price, but the days-on-market increase and the drop in over-asking sales both point to the same thing: buyers may have more room to negotiate than they did a year ago. Sellers pricing realistically from day one are still moving properties — those overreaching on list price (especially on homes that are not in great condition, updated, valuable upgrades or great views) are the ones sitting.
Condos: The Segment Feeling the Most Pressure
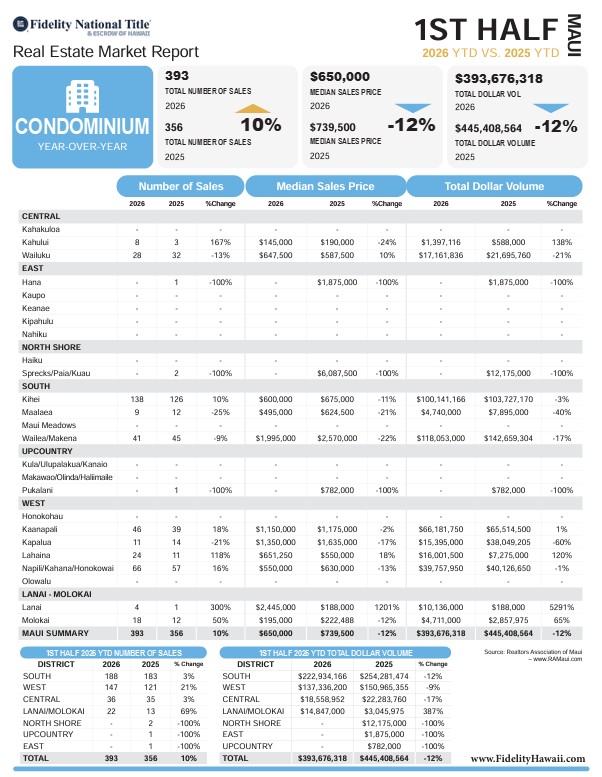
- 393 condos sold, up 10% — the strongest unit growth of any category
- Median price: $650,000, down 12%
- Median days on market: 127, up from 107
- 14.2 months of supply, compared to 8.1 months for single-family homes
- Only 18% of condos sold at or above asking, vs. 17% from last year
Condos are trading more often, but at meaningfully lower prices and with much longer market times. Part of this is straightforward supply and demand — there’s nearly double the inventory cushion in condos compared to homes. But it also lines up with an ongoing story in Maui real estate: Bill 9 and Bill 88, the county’s evolving short-term rental “STR” legislation. Bill 9 is phasing out short-term rentals in apartment-zoned buildings (West Maui by 2029, island-wide by 2031), while Bill 88 is proposiing to offer case-by-case path for some buildings to retain STR use through new hotel-zoning categories. That uncertainty is affecting how investors value and time their condo purchases right now — and it’s a big reason the condo segment looks softer than the rest of the market. However, I am writing this blog post in July 11 and the condo market does feel like it is upticking!
Land: The Weakest Corner of the Market
- 68 parcels sold, down 14%
- Total dollar volume $62,759,500 down 45% — by far the steepest decline of any category
- West Maui land alone saw dollar volume drop 53%
Vacant land is clearly the segment buyers are most cautious on this year. Permitting process is lengthy, building materials have gone up and finding architects and contractors is not easy.
South Maui Is Busy — But Not at Last Year’s Price Points
South Maui (Kihei, Wailea, Maui Meadows) recorded the most sales of any district — 280 closings, or 34% of everything that sold on island. Kihei in particular stood out, with home sales up 28% and condo sales up 10%.
But here’s the nuance: South Maui’s total dollar volume still fell 20% year-over-year. That tells us the activity is concentrated in the mid-market — more transactions, but not at the premium end that drove volume in 2025. Wailea/Makena condo dollar volume, for example, dropped 17%, and land there fell 75%.
Luxury Is Still Trading — Just More Selectively
It’s not all caution at the top. The highest recorded home sale this half was 730 Lower Kimo Dr at $9,875,000, and the highest condo sale was Makena Surf #A103 at $9,000,000. Well-positioned luxury properties are still closing at strong numbers — buyers just aren’t chasing everything at every price the way they were a year or two ago. We currently have Wailea Point 1103 under contract. List price is $7,495,000
Looking at the pending/closed/new listings historical trends (2017 through Jun-2026), a few things jump out — and this is where the “why” behind the condo softness really shows up.
Note on the data: the 2017–2025 columns are full calendar years, while “Jun-26” is just first-half 2026. So the interesting comparison isn’t the raw numbers year-to-year — it’s the relationship between pending, closed, and new listings within each period (the absorption pattern).
The absorption ratio tells the real story
If you look at new listings relative to closed sales each year, you get a rough “absorption ratio” — how much new supply is coming in versus how much is actually selling.
Single-family homes:
- 2017: 1,673 new listings / 1,099 closed = 1.52 (normal, pre-pandemic pace)
- 2021 (peak): 1,473 / 1,378 = 1.07 (super hot market, super low interest rates— almost everything absorbed)
- 2025: 1,199 / 708 = 1.69
- Q1 2026: 594 / 364 = 1.63
Homes are running at roughly the same absorption pace as last year — soft compared to the 2021 boom, but stable, not deteriorating further.
Condos — this is the one to watch:
- 2017: 1,994 / 1,451 = 1.37
- 2021 (peak): 2,117 / 2,315 = 0.91 (super hot, super low interest rates, demand actually outpacing new supply)
- 2025: 1,804 / 699 = 2.58 — a huge jump
- Q1 2026: 873 / 393 = 2.22
Condo absorption has nearly tripled since the pandemic peak. New listings are coming in at more than double the rate of closings. That’s the mechanism behind the 14.2-months-of-supply figure and the 127-day market times — it’s not a one-quarter blip, it’s a multi-year trendline that accelerated hard starting around 2023–2024, right in step with the Bill 9 STR phase-out timeline. Owners in most apartment-zoned buildings facing the potential loss of short-term rental rights, then the Lahaina fire affected rentals dramatically.
Pending sales as a leading indicator
Comparing pending to closed within the same period (Q1 2026):
- Single-family: 362 pending vs. 364 closed — essentially matched, meaning the back half of the year is shaping up flat relative to Q1, not accelerating. Important note that many single family home owners who had a low interest rate mortgage are not motivated to sell and then buy someting at a higher rate unless life events dictated such a move.
- Condos: 429 pending vs. 393 closed — pending is running ahead of closed, which is a positive signal. It suggests the second half of 2026 could see condo closings tick up slightly from Q1’s pace, even if the broader oversupply issue doesn’t resolve.
The bigger arc: 2021 was the anomaly, not the baseline
Both segments show the same shape: a demand spike in 2021 (pending/closed nearly matching new listings 1:1), followed by a steady climb in the ratio of new listings to closings every year since — condos especially. That’s a market normalizing after an unsustainable pandemic-era squeeze, but for condos it’s compounded by a structural policy shift (STR restrictions), Lahaina fire rather than just interest-rate fatigue, which is why the condo absorption ratio didn’t just return to 2017 levels — it went way beyond.
Practical takeaway: for sellers of condos (especially apt. zoned condos) , the math says supply is still outrunning demand by more than 2:1 — pricing and positioning need to account for that, not just for “the market’s a little slower.” For single-family sellers, the absorption pace is essentially unchanged year over year, so 2025’s playbook likely still applies in Q2 2026.
What This Means If You’re Thinking About Buying or Selling
For sellers: Pricing accuracy matters more this year than it has in recent memory. The days-on-market increases across every category — especially condos — suggest the market is punishing ambitious pricing more than it used to. A well-priced property for its category is still moving; an optimistically priced one is sitting. TALK TO YOUR TRUSTED REALTOR WITH A GOOD TRACK RECORD ON UNDERSTANDING THE MARKET, BUYER BEHAVIOR TODAY, MARKETING SKILLS, SHOWING SKILLS AND A GREAT ATTITUDE!
For buyers: You have more negotiating room than you’ve had in a while, particularly in condos, where inventory is nearly double what it is on the home side. If short-term rental income is part of your investment thesis, factor the Bill 9/Bill 88 timeline into your due diligence and definitely talk to your trusted realtor ! Getting a great buyer representation is important. Find a realtor who has a great track record, who has been in this business FULL time and has a great reputation!
FOR THE FULL HALF YEAR MARKET REPORT FOR 2026 CLICK HERE FOR FULL REPORT. CLICK HERE Final MAUI STATS 1st Half 2026 YTD
DO YOU WANT A HISOTRY OF MAUI REAL ESTATE STATISTICS? CLICK HERE.
MAHALO AND A HUI HOU…

Data source: Realtors Association of Maui, via Fidelity National Title & Escrow of Hawaii’s 1st Half 2026 YTD Market Report. Information is deemed reliable but not guaranteed. THANK YOU TO FIDELITY NATIONAL TITLE FOR PUTTING TOGETHER THE GRAPHICS AND INFO
Thinking about buying or selling on Maui? Let’s talk through what these numbers mean for your specific property or search — reach out anytime.
