
Why Maui Condos Are Sitting Longer: A Look at the Absorption Trend Behind the Numbers
Every market report gives you the snapshot — sales are up, prices are down, days on market are longer. What those year-over-year comparisons don’t always show is momentum: is a trend a one-time blip, or has it been building for years?
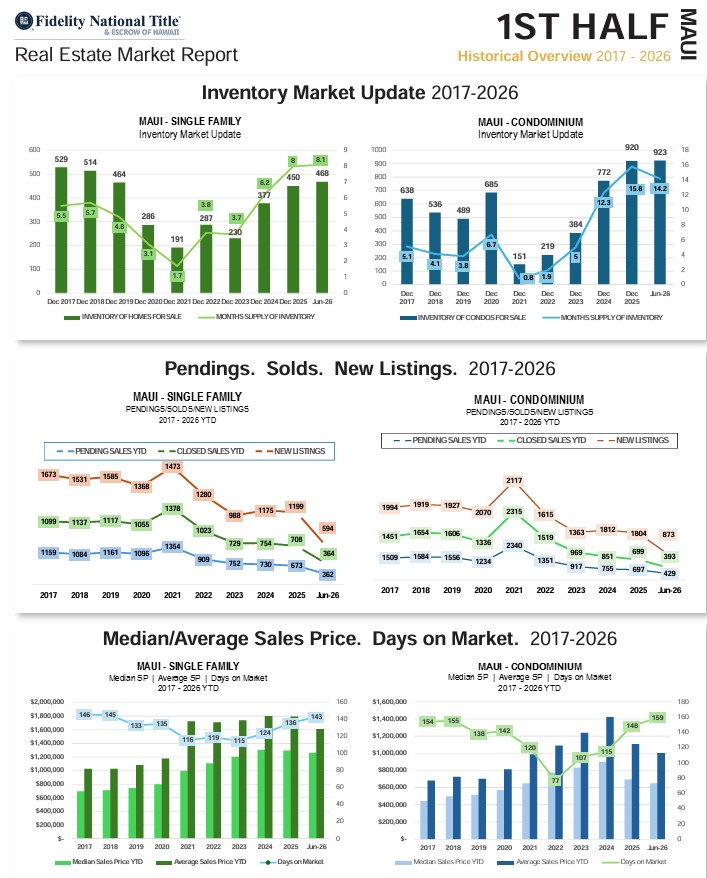
Looking at Maui’s pending sales, closed sales, and new listings data going back to 2017, a clear pattern emerges — and it explains a lot about why condos, in particular, are behaving so differently from single-family homes right now.
The Number That Matters More Than “Days on Market”
Days-on-market tells you how long a listing sits. But absorption — how many new listings are coming onto the market relative to how many are actually closing — tells you whether that’s a temporary lull or a structural imbalance.
Here’s the ratio of new listings to closed sales for Maui single-family homes and condos, at a few key points over the last decade:
Single-Family Homes
| Year | New Listings | Closed Sales | Ratio |
|---|---|---|---|
| 2017 | 1,673 | 1,099 | 1.52 |
| 2021 (pandemic peak) | 1,473 | 1,378 | 1.07 |
| 2025 | 1,199 | 708 | 1.69 |
| Q1 2026 | 594 | 364 | 1.63 |
Condominiums
| Year | New Listings | Closed Sales | Ratio |
|---|---|---|---|
| 2017 | 1,994 | 1,451 | 1.37 |
| 2021 (pandemic peak) | 2,117 | 2,315 | 0.91 |
| 2025 | 1,804 | 699 | 2.58 |
| Q1 2026 | 873 | 393 | 2.22 |
Two very different stories are hiding in this table.
Homes: Back to Normal, Not Getting Worse
Single-family homes are running at almost exactly the same absorption pace in Q1 2026 as they did in 2025 — a ratio in the 1.6–1.7 range. That’s softer than the frenzied 2021 market (when nearly every new listing found a buyer), but it’s roughly in line with pre-pandemic norms. In plain terms: the home market corrected from an unsustainable high and has settled into a steady, if buyer-friendlier, rhythm. It isn’t deteriorating further — it’s stable.
Condos: A Trend That’s Been Building for Years
Condos tell a different story entirely. In 2021, condo demand was so strong that closings actually outpaced new listings (a ratio below 1.0 — extremely rare). Since then, the ratio has climbed almost every year, and by 2025 it had reached 2.58 — meaning new condo listings were coming onto the market at more than double the rate buyers were absorbing them.
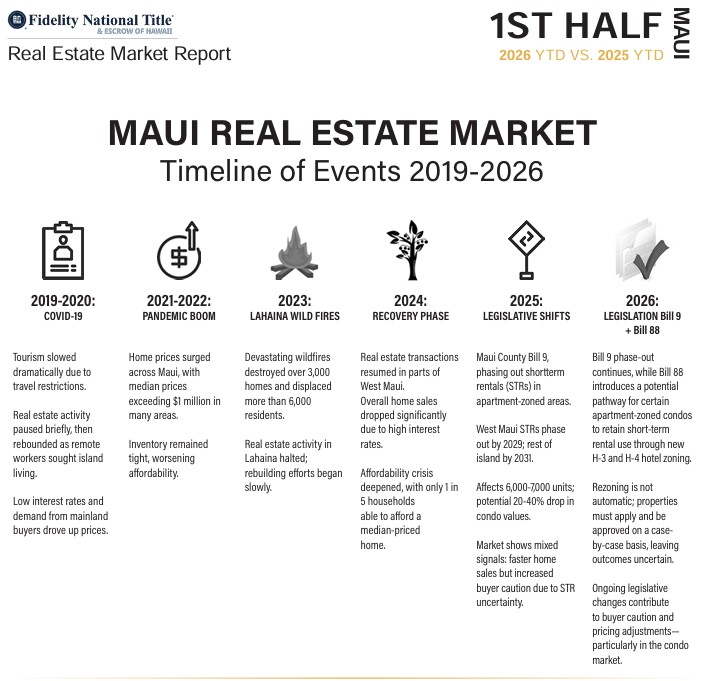
That’s not a one-quarter fluke. It’s a multi-year trend, and the timing lines up closely with Maui County’s Bill 9, which is phasing out short-term rentals in apartment-zoned buildings (West Maui by 2029, the rest of the island by 2031), along with the more recent Bill 88, which is proposed open a path for some buildings to retain STR use through new hotel-zoning categories.
Put simply: a meaningful number of condo owners in apartment-zoned buildings are listing because their income model is changing, while buyers — facing genuine uncertainty about a unit’s future rental rights — are taking longer to commit. That’s a supply-driven story, not just a “high interest rates” story, and it’s why condo months-of-supply (14.2 months) is running nearly double that of single-family homes (8.1 months). But Maui also had the Lahaina fire which affected our island, and tourism. Now keep in mind Maui is reslient and a strong sense of community and our visitor numbers are up!
What Pending Sales Suggest for the Second Half of 2026
Pending sales are a useful early read on where a market is headed, since they represent contracts already in motion.
- Single-family: 362 pending vs. 364 closed in Q1 — essentially flat. The second half of the year looks likely to track similarly to the first, not accelerate. BUT ONLY TIME WILL TELL. The other side is that if we had more inventory of homes, I believe our sales would be up. You cannot sell what you don’t have.
- Condos: 429 pending vs. 393 closed in Q1 — pending is running ahead of closed sales, a modestly encouraging sign. It suggests condo closings could tick up somewhat in the back half of the year, even if the broader oversupply dynamic doesn’t fully resolve.
Here is an outline of major events that occured on Maui.
What This Means If You Own or Are Considering a Condo
If you own a condo in an apartment-zoned building (and also hotel zoned building) this data is a good reason to have an honest conversation about pricing and timing sooner rather than later. With new listings still outpacing closings by more than 2:1, standing out requires more than “the market’s a little slower” pricing — it requires acknowledging that smart, market-driven approach is essential.
IMPORTANT NOTE: USING STATS TO DETERMINE YOUR SELLING OR BUYING IS JUST ONE TOOL BUT SHOULD NOT BE YOUR ONLY TOOL. WHY? BECAUSE MAUI REAL ESTATE MARKET IS VERY LOCAL. IT HAS MICRO MARKETS. FOR INSTANCE, ONE CONDOMINIUM COMPLEX MAY BE IN HIGH DEMAND THAT FAR OUTPACES AND OUTSELLS THE MARKET. OR IT COULD BE A PARTICULAR LOCATION IN A CERTAIN COMPLEX THAT MANY BUYERS WERE WAITING FOR; THEN IT COMES UP FOR SALE AND QUICKLY GOES UNDER CONTRACT. THIS IS WHAT OCCURRED WITH OUR WAILEA EKOLU 308 LISTING- WENT UNDER CONTRACT LESS THAN A MONTH OF BEING ON THE MARKET! SO HAVING A FULL-TIME MAUI REAL ESTATE PROFESSIONAL WHO UNDERSTANDS THE MARKET YOU WANT TO BUY OR SELL IN IS A MAJOR TOOL TO HAVE ON YOUR SIDE TO TRULY MAKE INFORMED DECISIONS.
WANT TO READ THE 2026 HALF YEAR MAUI MARKET REPORT- CLICK HERE.

Data source: Realtors Association of Maui, via Fidelity National Title & Escrow of Hawaii’s 1st Half 2026 YTD Historical Overview (2017–2026). Information is deemed reliable but not guaranteed.
Wondering how these trends apply to your specific building or neighborhood? Let’s dig into the numbers together — reach out anytime.
